GrAPHICAL REPRESENTATION OF A FREQUENCY DISTRIBUTION
✔ A convenient way of representing a sample frequency distribution is by means of graphs.
✔ It gives to the eyes the general run of the observations. It makes the raw data readily readable.
|
Histogram
✔ A histogram is a bar chart showing a distribution of variable quantities or characteristics.
✔ It is a graphical display of the frequency distribution of the numerical data. Refer Fig.1.
Frequency Polygon and Frequency Curve
✔ A frequency polygon is obtained by plotting mid-points of the classes (on the X-axis) against the class frequencies (on the Y-axis) and then joining these plotted points by a straight line. Refer Fig.1, Example 1.
✔ A frequency curve is obtained by drawing a smooth freehand curve through the points of the frequency polygon. Refer Fig.1, Example 1.
Example 1 : Following information relates to profits (Rs. crores) earned by 123 companies during 2001:
| Profits | 70-80 | 80-90 | 90-100 | 100-110 | 110-120 | 120-130 | 130-140 |
| Number of companies | 5 | 12 | 24 | 27 | 23 | 13 | 9 |
Present the above information graphically by drawing a (i) histogram,
(ii) frequency polygon, and (iii) frequency curve.
Solution: We take profits on the X-axis and number of companies on the Y-axis. Histogram is obtained by constructing rectangles on class intervals as bases, with heights equal to the class frequencies (number of companies). Joining upper mid-points of these rectangles, we obtain the frequency polygon, which upon smoothening yields the desired frequency curve, as shown in Fig.1.
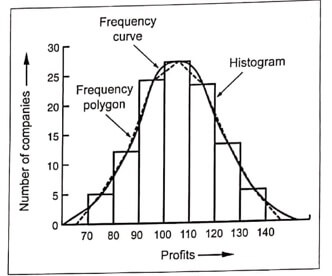
Fig.1. Histogram, frequency polygon and frequency curve
Cumulative Frequency Curves (Ogives)
✔ The cumulative frequency curve, also called an Ogive, obtained by plotting upper class limits against the ‘less than’ cumulative frequencies is known as ‘less than’ Ogive.
✔ ‘More than’ Ogive is obtained by plotting ‘more than’ cumulative frequencies against the lower class limits.
✔ An Ogive enables us to see how many observations lie above or below a specified value.
Comparison of Frequency Distributions
✔ In statistical work, it is frequently necessary to compare two frequency distributions.
✔ The chief constants which summarize the fundamental characteristics of the frequency distributions are:
|