CAUSE ANd EfFECT DIAGRAM (OR FISHBONe DIAGRAM)
What is it?
✔ The cause and effect (CE) diagram is a graphical-tabular chart to list and analyze the potential causes of a given problem.
✔ The cause and effect diagram is also called the fishbone diagram because of its appearance and the Ishikawa diagram after the man who developed it in 1943.
Fig.1 illustrates the basic structure of a cause and effect diagram.
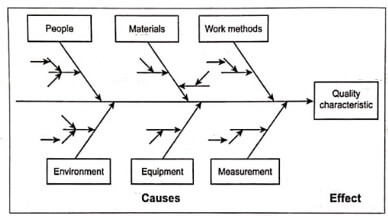
Fig.1. Cause and effect diagram
As shown in Fig.1, the diagram consists of a central stem leading to the effect (the problem), with multiple branches coming off the stem listing the various groups of possible causes of the problem.
When do we use it?
- The CE diagram has unlimited application in research, manufacturing, marketing, office operations, services, and so forth.
- The CE diagrams are used:
- To analyse cause and effect relationships;
- To facilitate the search for solutions of related problems;
- To standardize existing and proposed operations; and
- To educate and train personnel in decision-making and corrective-action activities.
How do we construct it?
- Define the effect (the problem) clearly and concisely.
- Mark the short description of the effect in a box. Then draw a line from this box towards left.
- List down all the possible minor and major causes through a brainstorming session.
- Mark the major causes on the branches and minor causes on the sub-branches of the CE diagrams.
- Look for possible solutions for these causes.
- Introduce the changes.
Illustrations
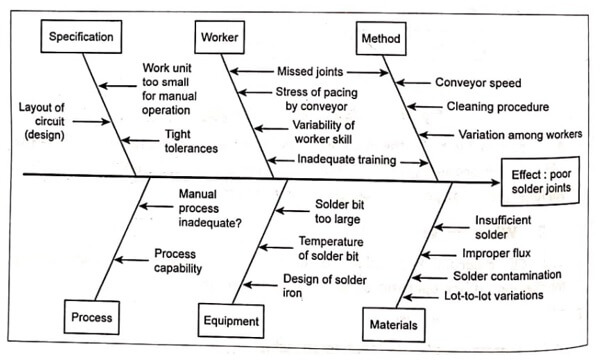
Example 1: A welding workshop receives a lot of complaints about poor quality solder joints. Analyze this problem by constructing a cause and effect diagram.
Effect: Poor solder joints.