The energies possessed by electrons in a metal is given by the energy distribution function.
Density of energy states 
Energy Distribution graph
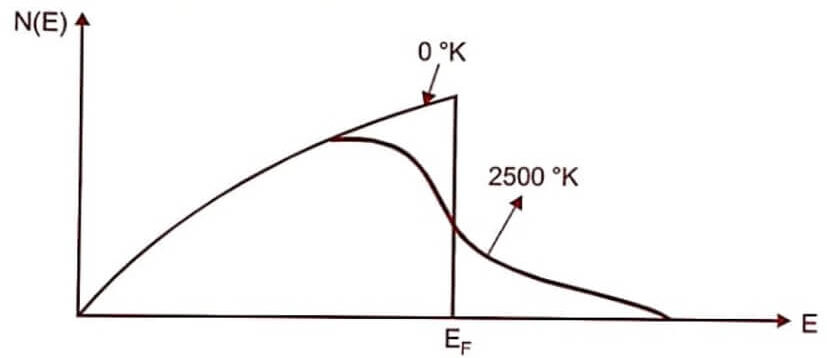
Fig (1)
- The energy distribution for the tungsten for T = 0° K and T= 2500°K.
- The area of the curve gives the total number of particles per unit volume.
- Form the graph, it is clear that even for larger variation of temperature (2500°K) the distribution function changes very slightly.
- When temperature increases, only the electrons with near EF are moved to the higher energy level and lower energy electrons are not disturbed.
| Read More Topics |
| Elemental and compound semiconductor |
| Fermi – Dirac distribution function |
| Fibre optic sensor working principle |