Imagine a wire to be suspended from a rigid support and carrying a hanger on which suitable weights could be placed to study the behaviour of the wire under conditions of different loads.
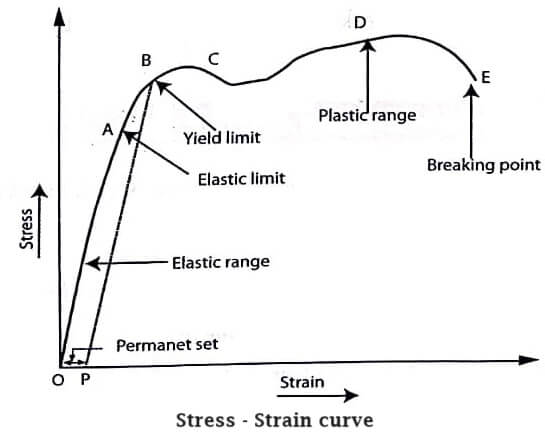
The extensions of the wire are suitably measured and thus stress and strain for the given wire is calculated. Now, if we go on changing stress, we get a stress – strain graph as in (Fig).
The relation between stress and strain is studied by drawing a curve called stressstrain diagram.
In the figure the part of the curve is a straightline which shows that upto the point A. In the region OA strain is proportional to the applied stress. This is Hooke’s law.

The point A represents the elastic limit. If the applied stress is within this limit, then the body recovers its original state. Therefore, the region OA represents the perfectly elastic region.
Beyond A, the graph is not linear. In the region AB the material is partly elastic and partly plastic. Under this condition, if we start decreasing the load, the graphy does not come to O via A, but traces a straightline OP.
The same is represented by a dotted lines in (Fig). The strain OP which is present in the body is called as residual strain and it acquires a permanent set.
Beyond B, addition of even a very small load causes enormous strain. This point B is called the yield point.
The region beyond point C and upto D is called plastic region. When strain increases steadily with stress, the cross sectional area of the solid decreases uniformly.
After the point D, strain increases without any addition of stress. The portion DE in the graph corresponds to the above state. The stress that corresponds to point D is called breaking stress or ultimate strength. At point E, the solid finally breaks and this is known as the breaking point.
| Read More Topics |
| Relation between lattice constant and density |
| Face centred cubic (FCC) structure |
| Classification of solids – Crystal physics |


