-
A monochromatic beam of X-rays is produced from an X-ray tube and is made to pass through the slits S1 and S2.
-
These X-rays are made to fall on a Carbon block ‘ C ‘ which acts as scatterer.
-
A Bragg’s spectrometer can freely swing in an arc about the scatterer as shown in Fig. (A).
-
The scattering ofX-ray photon can take place in different directions and their intensities can be measured by Bragg’s spectrometer.
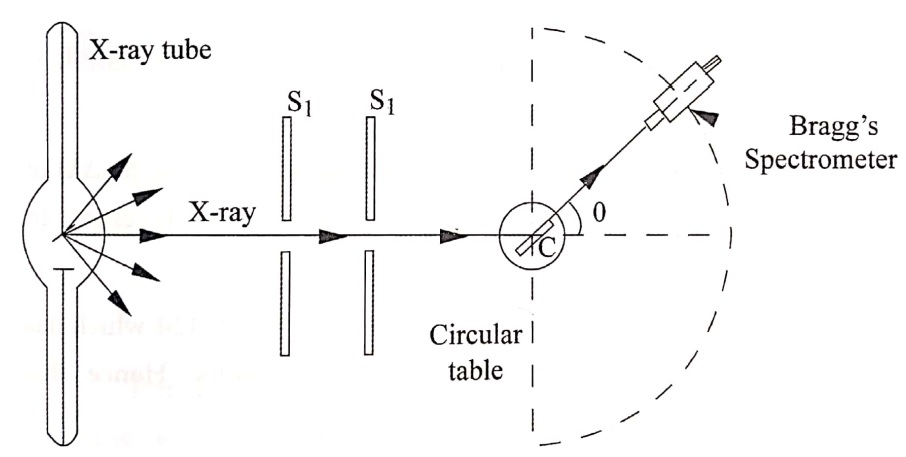 Fig. (A) Experimental verification of Compton effect
- The experiment is repeated for various scattering angles and the scattered wavelengths are measured.
- The experimental results are plotted in a graph between relative intensities and wavelengths as shown in Fig. (B).
- When θ=0, there is only one peak, is called unmodified peak.
- Then, we observe that for each value of θ=45º,90º,180º there are distinct intensity peaks for the two wavelengths, one of which corresponds to the incident radiation (λ) and the other has a higher value (λ). The peak corresponding to λ′ is called a modified peak.

Fig. (B). Compton shift
- The difference between these two peaks on wavelength is called Compton shifts.
- The shift in wave length (or) difference in wavelength (Δλ) of the two scattered beams is found to increase with respect to the increase in scattering angle.
- At θ=90º, the Δλ is found to be 0.0236≈0.02424 which has good agreement with the theoretical results. Hence this wavelength is called Compton wavelength.
| Read More Topics |
| Heat flow through a compound media or wall |
| Method to determine thermal conductivity |
| Newton’s law of cooling |