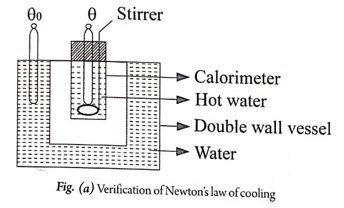
Take a calorimeter and its outer surface is polished. The calorimeter is fill it ¾th with hot water of about 80°c and suspend in a double walled vessel as shown in (Fig. a). The vessel is filled with water. A thermometer is used to read the temperature of the water in the vessel.

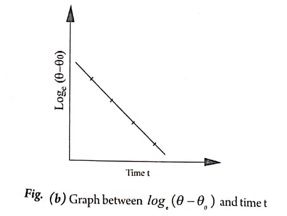
The water in the calorimeter is kept stirred and allowed to cool till its temperature approaches the surrounding temperature. The temperature of the calorimeter water is noted after regular intervals of time. A graph is plotted between loge ( θ-θ0) and time t. It is a straight line graph as shown in (Fig. b) and hence Newton’s law of cooling is verified.

| Read More Topics |
| Thermal conductivity of rubber |
| Three types of moduli elasticity |
| Hooke’s law |


