What is it?
✔ A flow chart, also known as process flow chart, flow diagram, and process deployment flow, is a diagrammatic view of the various steps in sequential order that form an overall process in an organisation.
✔ Flow charts are used in the quality management for depicting the steps of a process in an easily understandable form, by using standard symbols.
✔ In other words, the flow chart is a simple mapping tool that shows the sequence of actions within a process, in a form that is easy to read and communicate.
When do we use it?
✔ A flow chart is used to document and analyze the connection and sequence of events in a process.
✔ It is used to create an integrated understanding of the activities that are performed and the relationship between the different process steps.
How do we construct it?
The standard symbols used for constructing the flow process chart are presented in Table 1.
Table 1. Symbols used for constructing flow chart
| S. NO | Symbol | Name | Meaning |
| 1. | Terminator | For indicating the start or end of the flow process chart. | |
| 2. | Action (Rectangle) | For indicating a process or activity or task or operation. | |
| 3. |  |
Decision (Diamond) | For indicating a decision. |
| 4. | → | Arrows | For indicating the direction of flow of the process. |
| 5. | Link | For indicating a link to another page or another flow chart |
- Decide on the process to be investigated.
- Define the start, the end and the borders of the process.
- List the steps in the process by determining the activities, decisions, inputs and outputs of the process.
- Draw the chart placing the process steps in the order of their sequence using the standard symbols shown in Table 1.
- Compare the flow chart with the actual process.
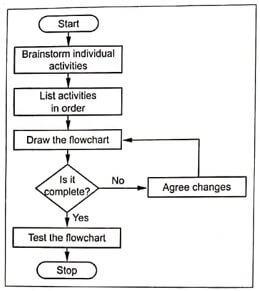
Fig.1 presents a flowchart for drawing a flowchart.

Fig.1. Flowchart for drawing a flowchart


