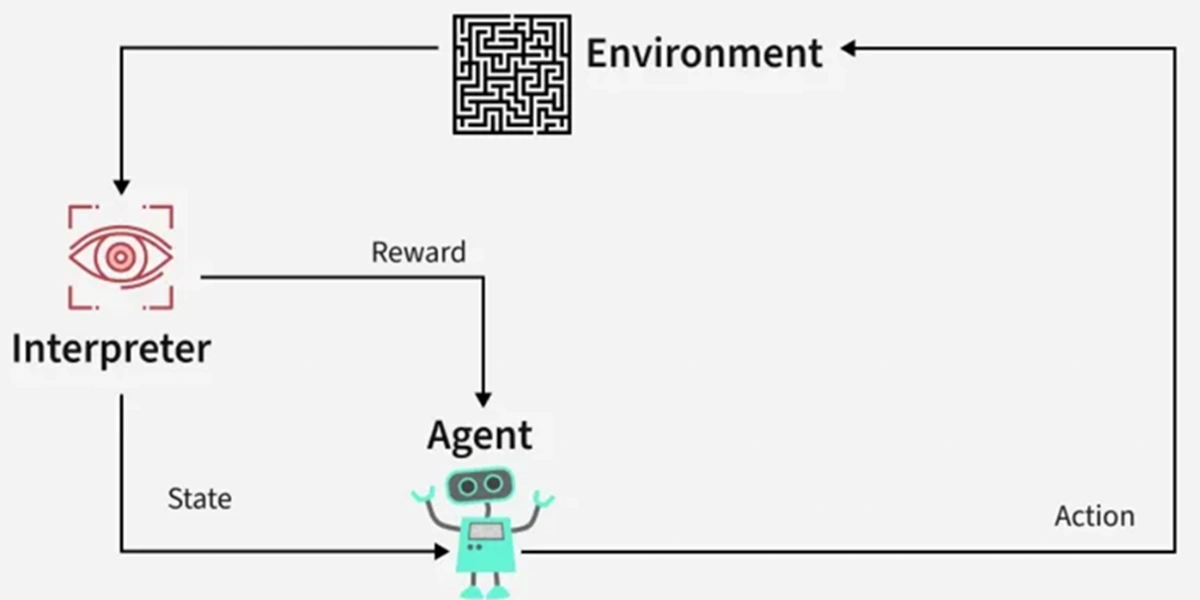
Machine learning algorithms are like the recipes of the AI kitchen. They’re sets of instructions that enable computers to learn from data and make decisions or predictions without explicit programming. Think of them as clever chefs that get better at cooking as they experiment with more recipes. Below top 10 machine learning algorithms.
- Linear Regression
- Logistic Regression
- Decision Trees
- Random Forest
- Support Vector Machines (SVM)
- K-Nearest Neighbors (KNN)
- Naive Bayes
- K-Means Clustering
- Principal Component Analysis (PCA)
- Neural Networks (Deep Learning)
Linear Regression
Explanation : Imagine you want to predict the price of a house based on its size. Linear regression helps you do this by finding a straight line that best fits the historical data of house sizes and their prices. This line is called the “regression line.”
Example : Suppose you have data on the sizes of different houses and their corresponding sale prices. Linear regression finds the equation of the line (e.g., Price = 100 * Size + 50,000) that best represents this data. Now, you can use this equation to predict the price of any house based on its size.

Logistic Regression
Explanation : Imagine you want to classify emails as either spam or not spam based on their content. Logistic regression can help by analyzing the words in emails and assigning a probability of them being spam. If the probability is above a certain threshold, it’s classified as spam; otherwise, it’s not.
Example : When you receive an email, the logistic regression model calculates the probability that it’s spam. If the probability is 0.8 (80%), it’s likely to be spam, and your email filter will move it to the spam folder.

Decision Trees
Explanation : Think of decision trees as a series of questions you ask to make a decision. In the context of house prices, a decision tree might start by asking if the house has more than four bedrooms. Depending on the answer, it asks more questions until it predicts the price.
Example : To predict the price of a house, a decision tree might start by asking if the house size is above 2,000 square feet. If yes, it proceeds with more questions; if not, it predicts a lower price based on that initial decision.

Random Forest
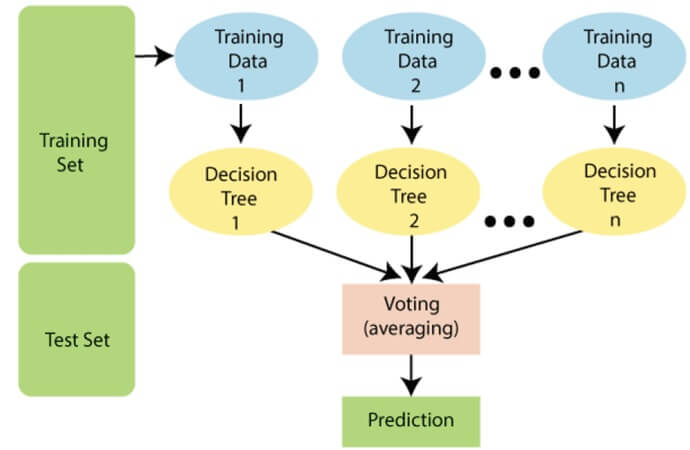
Explanation : A random forest is like a group of decision trees voting on the price of a house. Each tree gets a vote, and the forest combines their opinions to make a final prediction. This usually leads to a more accurate result than a single decision tree.
Example : To predict house prices, a random forest uses multiple decision trees. One tree might focus on the size of the house, another on the neighborhood, and so on. The random forest combines their predictions to arrive at a more accurate price estimate.
Support Vector Machines (SVM)
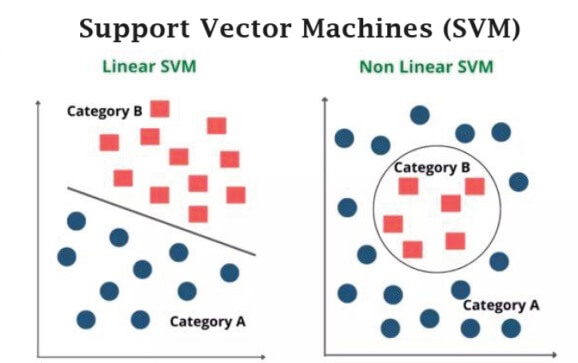
Explanation : SVM is like drawing a line between houses that cost a lot and those that cost less. It tries to find the best line (or hyperplane) that separates high-priced houses from low-priced ones based on features like size and location.
Example : SVM draws a line on a scatterplot of house sizes and prices. This line separates houses into two categories: expensive and affordable. The goal is to find the line that maximizes the separation between these two groups.
K-Nearest Neighbors (KNN)
Explanation : KNN is like asking your neighbors for advice. If most of your neighbors have expensive houses, your house is likely to be expensive too. KNN classifies a house by looking at the prices of its nearest neighbors.
Example : To predict the price of a house, KNN looks at the prices of the nearest houses (e.g., the five closest houses) and takes an average. If those houses are expensive, it predicts a higher price for the house in question.

Naive Bayes
Explanation : Naive Bayes is like counting words in emails to decide if they are spam or not. It calculates the probability of an email being spam or not based on the frequency of certain words.
Example : Naive Bayes looks at words like “free,” “money,” and “discount” in emails. If these words appear frequently, it assigns a higher probability to the email being spam. If not, it’s less likely to be spam.

K-Means Clustering
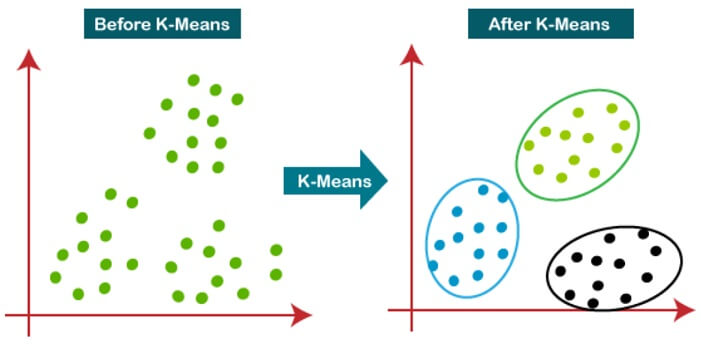
Explanation : K-Means is like grouping houses into neighborhoods based on their similarities. It finds clusters of houses that are close to each other in terms of features like size, price, and location.
Example : K-Means groups houses into clusters. For instance, it may identify a cluster of large, expensive houses in a particular neighborhood and a cluster of smaller, affordable houses in another neighborhood.
Principal Component Analysis (PCA)
Explanation : PCA is like simplifying a complex painting into its main colors. It reduces the dimensions of data while keeping the essential information. In house price prediction, it might reduce many features (like the number of rooms, bathrooms, and square footage) into a few key factors.
Example : PCA could simplify the features of a house (e.g., size, number of rooms, and location) into a single score that represents its overall desirability or price.

Neural Networks (Deep Learning)
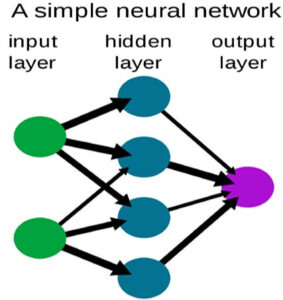
Explanation : Neural networks are like a complex puzzle solver. They can learn to recognize patterns in data, making them powerful for tasks like image recognition. In house price prediction, a neural network might analyze many features and find intricate relationships.
Example : A neural network might examine various features like house size, neighborhood crime rates, and nearby schools to predict house prices. It does this by learning from a massive dataset and finding hidden patterns that humans might miss.
| Read More Topics |
| PostgreSQL cheat sheet |
| Oracle SQL cheat sheet |
| HTML Cheat sheet with examples |

