Point to Point Links
The simplest transmission link is a point to point links line that has a transmitter on one end and a receiver on the order. This type of link places the least demand on optical fiber technology and thus sets the basis for examining more complex system architectures1-10.

The design of an optical link involves many interrelated variables among the fiber, source, and photodetector operating characteristics, so that the actual link design and analysis may require several iterations before they are completed satisfactorily.
Since performance and cost constraints are very important factors in fiber optic communication links, the designer must carefully choose the components to ensure that the desired performance level can be maintained over the expected system lifetime without over specifying the component characteristics.
The following key system requirements are needed in analyzing a link:
- The desired (or possible) transmission distance.
- The data rate or channel bandwidth
- The bit-erro0r rate (BER)
To fulfill these requirements the designer has a choice of the following components and their associated characteristics:
Multimode or single-mode optical fiber
- Core size
- Core refractive-index profile
- Bandwidth or dispersion
- Attenuation
- Numerical aperture or mode-field diameter
LED or laser diode op0tical source
- Emission wavelength
- Spectral line width
- Output power
- Effective radiating area
- Emission pattern
- Number of emitting modes
Pin or avalanche photodiode
- Responsivity
- Operating wavelength
- Speed
- Sensitivity
The preceding chapters have presented the fundamental characteristics of the individual building blocks of an optical fiber transmission link.
These include the optical fiber transmission medium, the optical source, the photodetector and its associated receiver, and the connectors used to join individual fiber cables to each other and to the source and detector.
Now we shall examine how these individual parts can put together to form a complete optical fiber transmission link. In particular, we shall study basic digital links in this chapter, and analog links in upcoming post. More complex transmission links are examined in next post.
The first discussion involves the simplest case of a point to point links. This will include examining the components that are available for a particular application and seeing how these components relate to the system performance criteria (such as dispersion and bit-error rate).
For a given set of components and a given set of system requirements, we then carry out a power budget analysis to determine whether the fiber optic link meets the attenuation requirements or if amplifiers are needed within the link to boost the power level.
The final step is to perform a system rise-time-analysis to verify that the overall system performance requirements are met.
The analysis in Sec. assumes that the optical power falling on the photodetector is a clearly defined function of time within the statistical nature of the quantum detection process. In reality, various signal impairments can degrade the link performance.
These impairments can reduce the power of the optical signal arriving t the receiver from the ideal case, which is known as a power penalty for that effect. This section describes the power penalties associated with some key impairments that may be observed in an optical link.
To control errors and to improve the reliability of a communication line, it is necessary to be able to detect the errors and then correct them or retransmit the information. Section describes error detection and correction method that are used in a variety of optical fiber communication links.
Note that versatile and powerful modeling and simulation tools can run on commercially available for doing many of the tasks described in this chapter.
These software-based tools can run on conventional personal computers and include functions such as estimations of the BER and power-penalty effects with different optical receiver models, calculations of link power budgets, and simulation of link performance when using different components.
The book website (see the URL given in the preface) provides links to several of the vendor websites of such modeling and simulation tools.
Two analyses usually are carried out to ensure that the desired system performance can be met; these are the point to point links power budget and the system rise-time budget analyses.
In the link power budget analysis sensitivity needed to establish a specified BER. This margin can then be allocated to connector, splice, and fiber losses, plus any additional margins required for other components, possible component degradations, transmission-line impairments, or temperature effects.
If the choice of components did not allow the desired transmission distance to be achieved, the components might have to be changed or amplifiers might have to be incorporated into the point to point links.
Once the link power budget has been established, the designer can perform a system rise-time analysis to ensure that the desired overall system performance has been met. We shall now examine these two analysis in more detail.
System Considerations
In carrying out a point to point links power budget, we first decide at which wavelength to transmit and then choose components that operate in this region.
If the distance over which the data are to be transmitted is not too far, we may decide to operate in the 770-to-910 nm region. On the other hand, if the transmission distance is relatively long, we may want to take advantage of the lower attenuation and dispersion that occurs in the O-band through U-band region.
Having decided on a wavelength, we next interrelate the system performances of the three major optical link building blocks: that is, the receiver, transmitter, and optical fiber.
Normally, the designer chooses the characteristics of two of these elements and then computes those of the third to see if the µµsystem performance requirements are met.
If the components have been over or under-specified a design iteration may be needed. The procedure we shall follow here is first to select the photodetector.
We then choose an optical source and see how far data can be transmitted over a particular fiber before an amplifier is needed in the line to boost up the power level of the optical signal.
In choosing a particular photodetector, we mainly need to determine the minimum optical power that must fall on the photodetector to satisfy the bit-error rate (BER) requirement at the specified data rate.
In making this choice, the designer also needs to take into account any design cost and complexity constraints.
As noted in Chapters next, a pin photodiode receiver is simpler, more stable with changes in temperatures, and less expensive than an avalanche photodiode receiver.
In addition, pin photodiode bias voltages are normally less than 5V, whereas those of avalanche photodiodes range from 40V to several hundred volts. However, the advantages of pin photodiode may be overruled by the increased sensitivity of the avalanche photodiode if very low optical power levels are to be detected.
The system parameters involved in deciding between the use of an LED and a laser diode are signal dispersion, data rate, transmission distance, and cost.
As the spectral width of the laser output is much narrower than that of an LED. This is of importance in the 770-to-910-nm region, where the spectral width of an LED and the dispersion characteristics of multimode silica fibers limit the data-rate-distance product to around 150 (Mb/s).km.
For higher values (up to 2500 (Mb/s).km], a laser must be used at these wavelengths. At wavelength around 1.3µm, where signal dispersion is very low, bit-rate-distance products of at least 1500 (Mb/s).km are achievable with LEDs in multimode fibers.
For InGaAsP lasers, this figure is in excess of 25(Gb/s).km at 1.3 µm. A single-mode fiber can provide significantly higher rates over longer distances.
Since laser diodes typically couple from 10 to 15 dB more optical power into a fiber than an LED, greater repeaterless transmission distances are possible with a laser.
This advantage and the lower dispersion capability of laser diodes may be offset by cost constraints. Not only is a laser diode itself more expensive than an LED, but also the laser transmitter circuitry is much more complex, since the lasing threshold has to be dynamically controlled as a function of temperature and device aging. However, a wide variety of cost-effective laser transmitter are on the market.
For the optical fiber, we have a choice between single-mode and multimode fiber, either of which could have a step-or a graded-index core. This choice depends on the type of light source used and on the amount of dispersion that can be tolerated. Light-emitting diodes (LEDs)tend to be used with multimode fibers.
The optical power that can be coupled into a fiber from an LED depends on the core-cladding index difference Δ, which, in turn, is related to the numerical aperture of the fiber (for Δ = 0.01, the numerical aperture NA = 0.21). As Δ increases, the fiber-coupled power increases correspondingly.
However, since dispersion also becomes greater with increasing Δ, a tradeoff must be made between the optical power that can be launched into the fiber and the maximum tolerable dispersion.
When choosing the attenuation characteristics of a cabled fiber, the excess loss that results from the cabling process must be considered in addition to the attenuation of the fiber itself.
This must also include connector and splice losses as well as environmental induced losses that could arise from temperature variations, radiation effects, and dust and moisture on the connectors.
Link Power Budget
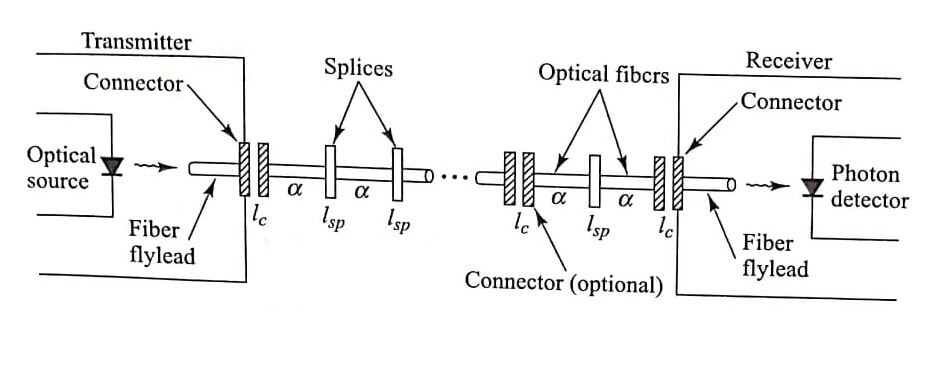
An optical power loss model for a point to point links. The optical power received at the photodetector depends on the amount of oi9ght coupled into the fiber and the losses occurring in the fiber and at the connectors and splices.
The link loss budget is derived from the sequential loss contribution of each element in the link. Each of these loss elements is expressed in decibels (dB) as
Loss= 10 log
Where Pin and Pout are the optical powers entering and leaving the loss element, respectively.
In addition to the link loss contributors link power margin is normally provided in the analysis to allow for component aging, temperature fluctuations, and losses arising from components that might be added at future dates.
A link margin of 6-8 dB is generally used for systems that are not expected to have additional components incorporated into the link in the future.
The link loss budget simply considers the total optical power loss PT that is allowed between the light source and the photodetector, and allocates this loss to cable attenuation, connector loss, splice loss, and system margin.
Thus, if PS is the optical power emerging from the end of a fiber flylead attached to the light source or from a source coupled connector, and if PR is the receiver sensitivity, then
PS= PS-PR
2lc + αL + system margin
Here, lc is the connector loss, α is the fiber attenuation (dB/km), L is the transmission distance, and the system margin is nominally taken as 6 dB.
Here, we assume that the cable of length L has connectors only on the ends and none in between. The splice loss is incorporated into cable loss for simplicity.
- See More : Series capacitor voltage
- See More : Radio over fiber links
- See More : Analog link in optical


